A list of significant genes is a means, not an end. Functional enrichment asks: what biological processes are over-represented among the genes that changed? For a hypoxia experiment, we expect terms like response to hypoxia, glycolysis, and angiogenesis.
Pick the gene sets
We need two lists: the significant up-regulated genes, and the universe of all tested genes (so enrichment is measured against the right background). GENCODE IDs carry a version suffix (.17) that the annotation database doesn’t use, so we strip it.
Try this prompt
From the DESeq2 results, take genes with padj < 0.05 and log2FoldChange > 1 as the up-regulated set, and all tested genes as the universe. Strip the Ensembl version suffix from the IDs.
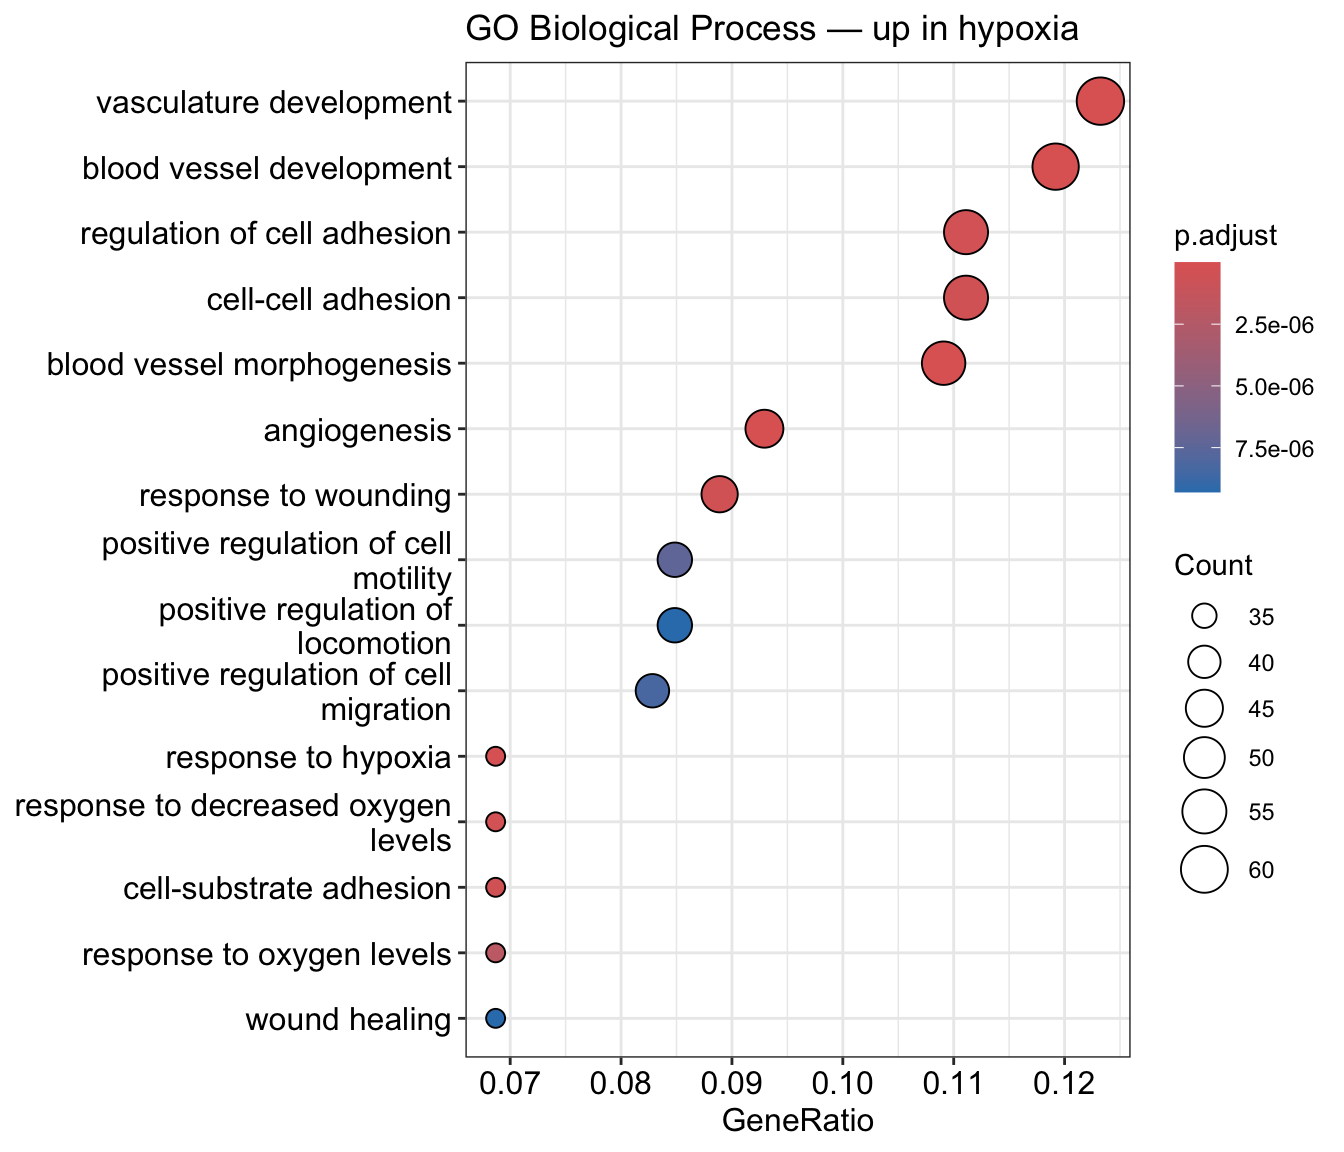
Run a GO Biological Process over-representation test on the up-regulated genes with clusterProfiler, using org.Hs.eg.db, Ensembl IDs, and the universe as background. Show the top terms.
if (!is.null(ego) &&nrow(as.data.frame(ego)) >0) {dotplot(ego, showCategory =15) + ggplot2::labs(title ="GO Biological Process — up in hypoxia")} else {message("No enriched terms at the chosen thresholds on this subset.")}
Note
With a subset of reads and only two replicates per group, the exact terms vary, but the hypoxia / metabolic signal should dominate. On the full dataset the enrichment is sharper.
Where to go further
Ask Claude Code to extend the analysis:
GSEA instead of over-representation — clusterProfiler::gseGO() on a ranked gene list (uses every gene, no hard cutoff).
Pathways — KEGG (enrichKEGG) or Reactome (ReactomePA::enrichPathway).
MSigDB Hallmark gene sets via msigdbr + enricher — the HALLMARK_HYPOXIA set is the obvious target here.
→ Recap and how to use this on your own data — 6 · Wrap-up.